Online Technical Graphing App for Scientists and Engineers
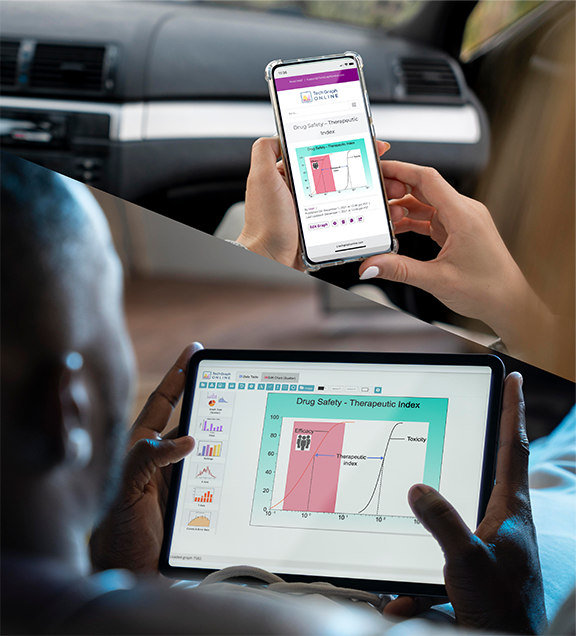
You need the power to create publication-quality technical graphs and charts, yet you also want an application that is easy to use and learn. The TechGraphOnline Graphing App gives you both!
TechGraphOnline gives you the freedom to work from any place. All you need is access to a major browser (Chrome, Edge, Firefox, Safari) on your PC, Mac, or iPad. Your files are stored as a personal library in our cloud. You can share any chart with your colleagues instantly by copying the URL link to the clipboard, email, or social media.
But don’t take our word for it; why not try our app and see for yourself? No obligations, no credit card. Sign up for FREE today!
Our Graphing App makes your data look terrific!
You work hard to collect the data for your report, publish your paper, and present to your peers. TechGraphOnline can transform your data into technical graphs that get noticed and remembered. You can count on us to create graphs that communicate your complex data in a clean, concise, and impactful way to your audience.
No more pixelated images! The TechGraph sample charts below are made in SVG (Scalable Vector Graphics) image format — ideal for web publishing, it allows scaling of the chart to any size and still creates sharp, crisp images. Charts will not have jagged lines or blurred characters. Compare your results to charts produced by our competitors; you will surely see the difference!
Get Started Quickly with Over 100 Specialized Graph Templates!
We’ve created over 100 clean, professional graph templates to make graphing your data even easier. Simple choose one and then customize it with your data and options to get the sophisticated graph you want in minutes. Each template has notes about how to create / customize this particular type of graph to help guide you.
A Graphing App that is Easy to Use and Learn
TechGraphOnline is easy to learn and easy to use. The process to create complex scientific 2D graphs is simple and direct. Yet, you have powerful features and analysis tools to enhance and customize your graphs. Online feature sensitive help is available to provide assistance.
Step 1
At log-on, your personal library of graphs is displayed on the My Graphs page.
To create a new Graph, click on Graphs → Add New Graph… to start with an empty graph or choose from over 100 pre-made templates. Your graph will open immediately in the TechGraph Editor.
Use the following panel buttons to modify an existing graph:
Edit Graph activates the TechGraph Editor to modify the selected graph
Properties allows you to attach notes, name the graph, and change privacy settings
Delete deletes the graph
Clone duplicates the graph
Share copies the URL link to the clipboard, email, or via social media
Use the Search options to quickly find graphs by date, notes, type, or title.
Step 2
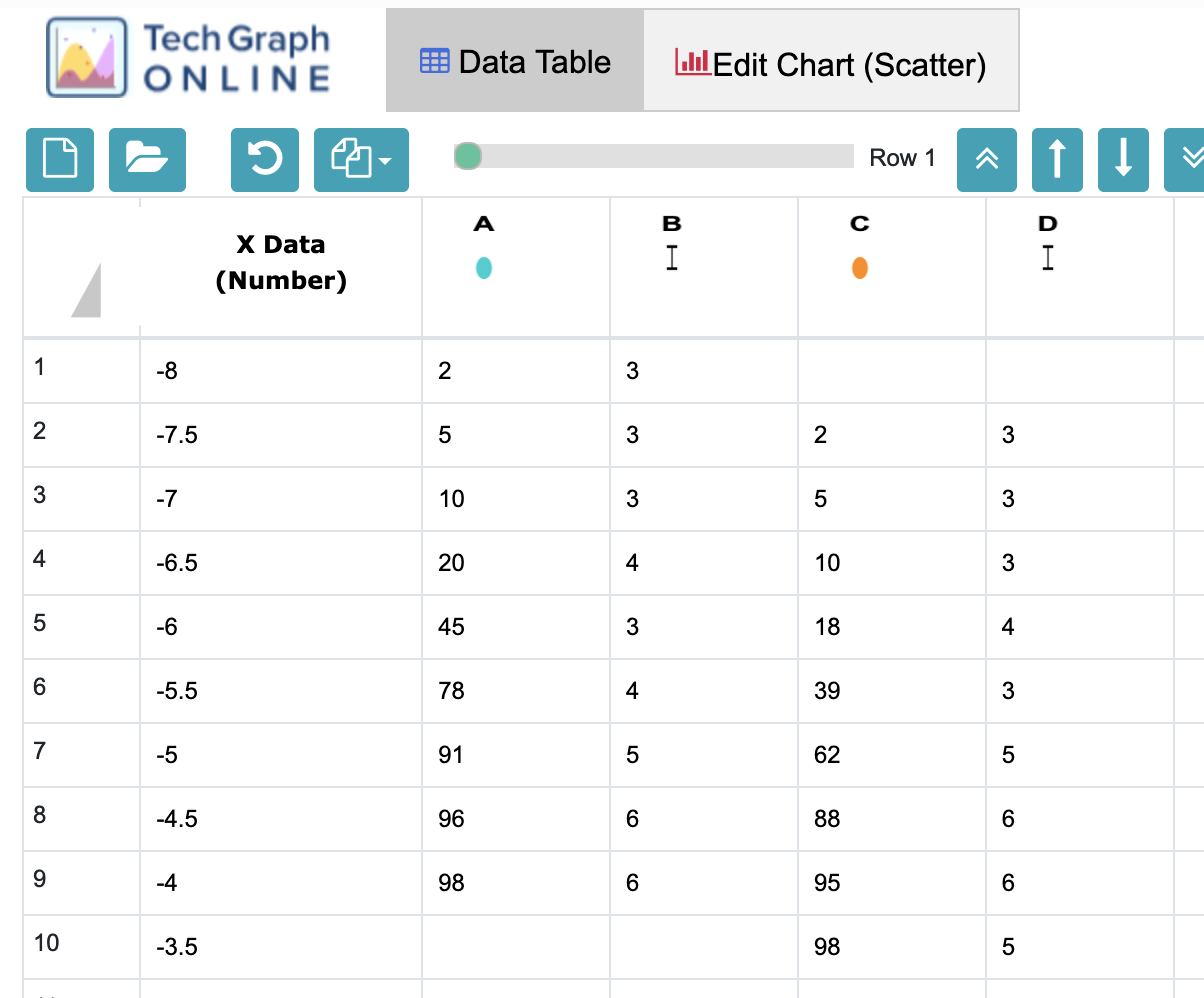
Once you access the TechGraph Editor, your data is shown in the Data Table screen. Enter the data directly, copy/paste data from Excel or Google sheets, or upload a CSV/Text data file from this screen.
Options to fill and transform data columns, linear and nonlinear curve fits, and data analysis are available here.
Step 3
Your graph is shown in the Edit Chart screen. Using the Chart Icons, the graph type, settings, axes options, curve fit and error bar settings, and the appearance of your graph are chosen.
As an example, the X Axis Icon allows you to set the scale (linear, log or probability) of the axis, set the minimum and maximum values of the axes and control the grid settings.
You can quickly customize your graph with annotations, lines, boxes and even images of your company logo. You can resize and move your graph frame, add background colors, and positions of the titles.
Download your graph images as SVG files or high-resolution image (PNG, JPG, TIF) files for reports and presentations.
Graphing App Features
With TechGraphOnline, you can create terrific charts and graphs for technical presentations, publications, reports, images for webpages and more. Using our advanced scientific features, you can quickly create complex drawings and 2D graphs.
TechGraphOnline is so Easy to Learn and Use, it stands apart from other presentation software. Check out just some of the features that make TechGraphOnline great!
Full-Featured Graphing Capability
Advanced Graphing Features:
Curve Fitting, Error Bars, and Statistics
Curve Fitting, Error Bars, and Statistics
Customization Options
Easily annotate a graph with text, lines, and arrows or dynamically place and size graph images anywhere to create multiple graphs on a page, or place a scanned company logo on your chart with our drawing features.
Nonlinear Curve Fits and Data Analysis in Three Easy Steps
Step 1: Enter your data into the Data Table
- Enter data manually
- Copy/Paste data from Excel or Google Sheet.
- Download data from CSV (Comma Separated Value) file.
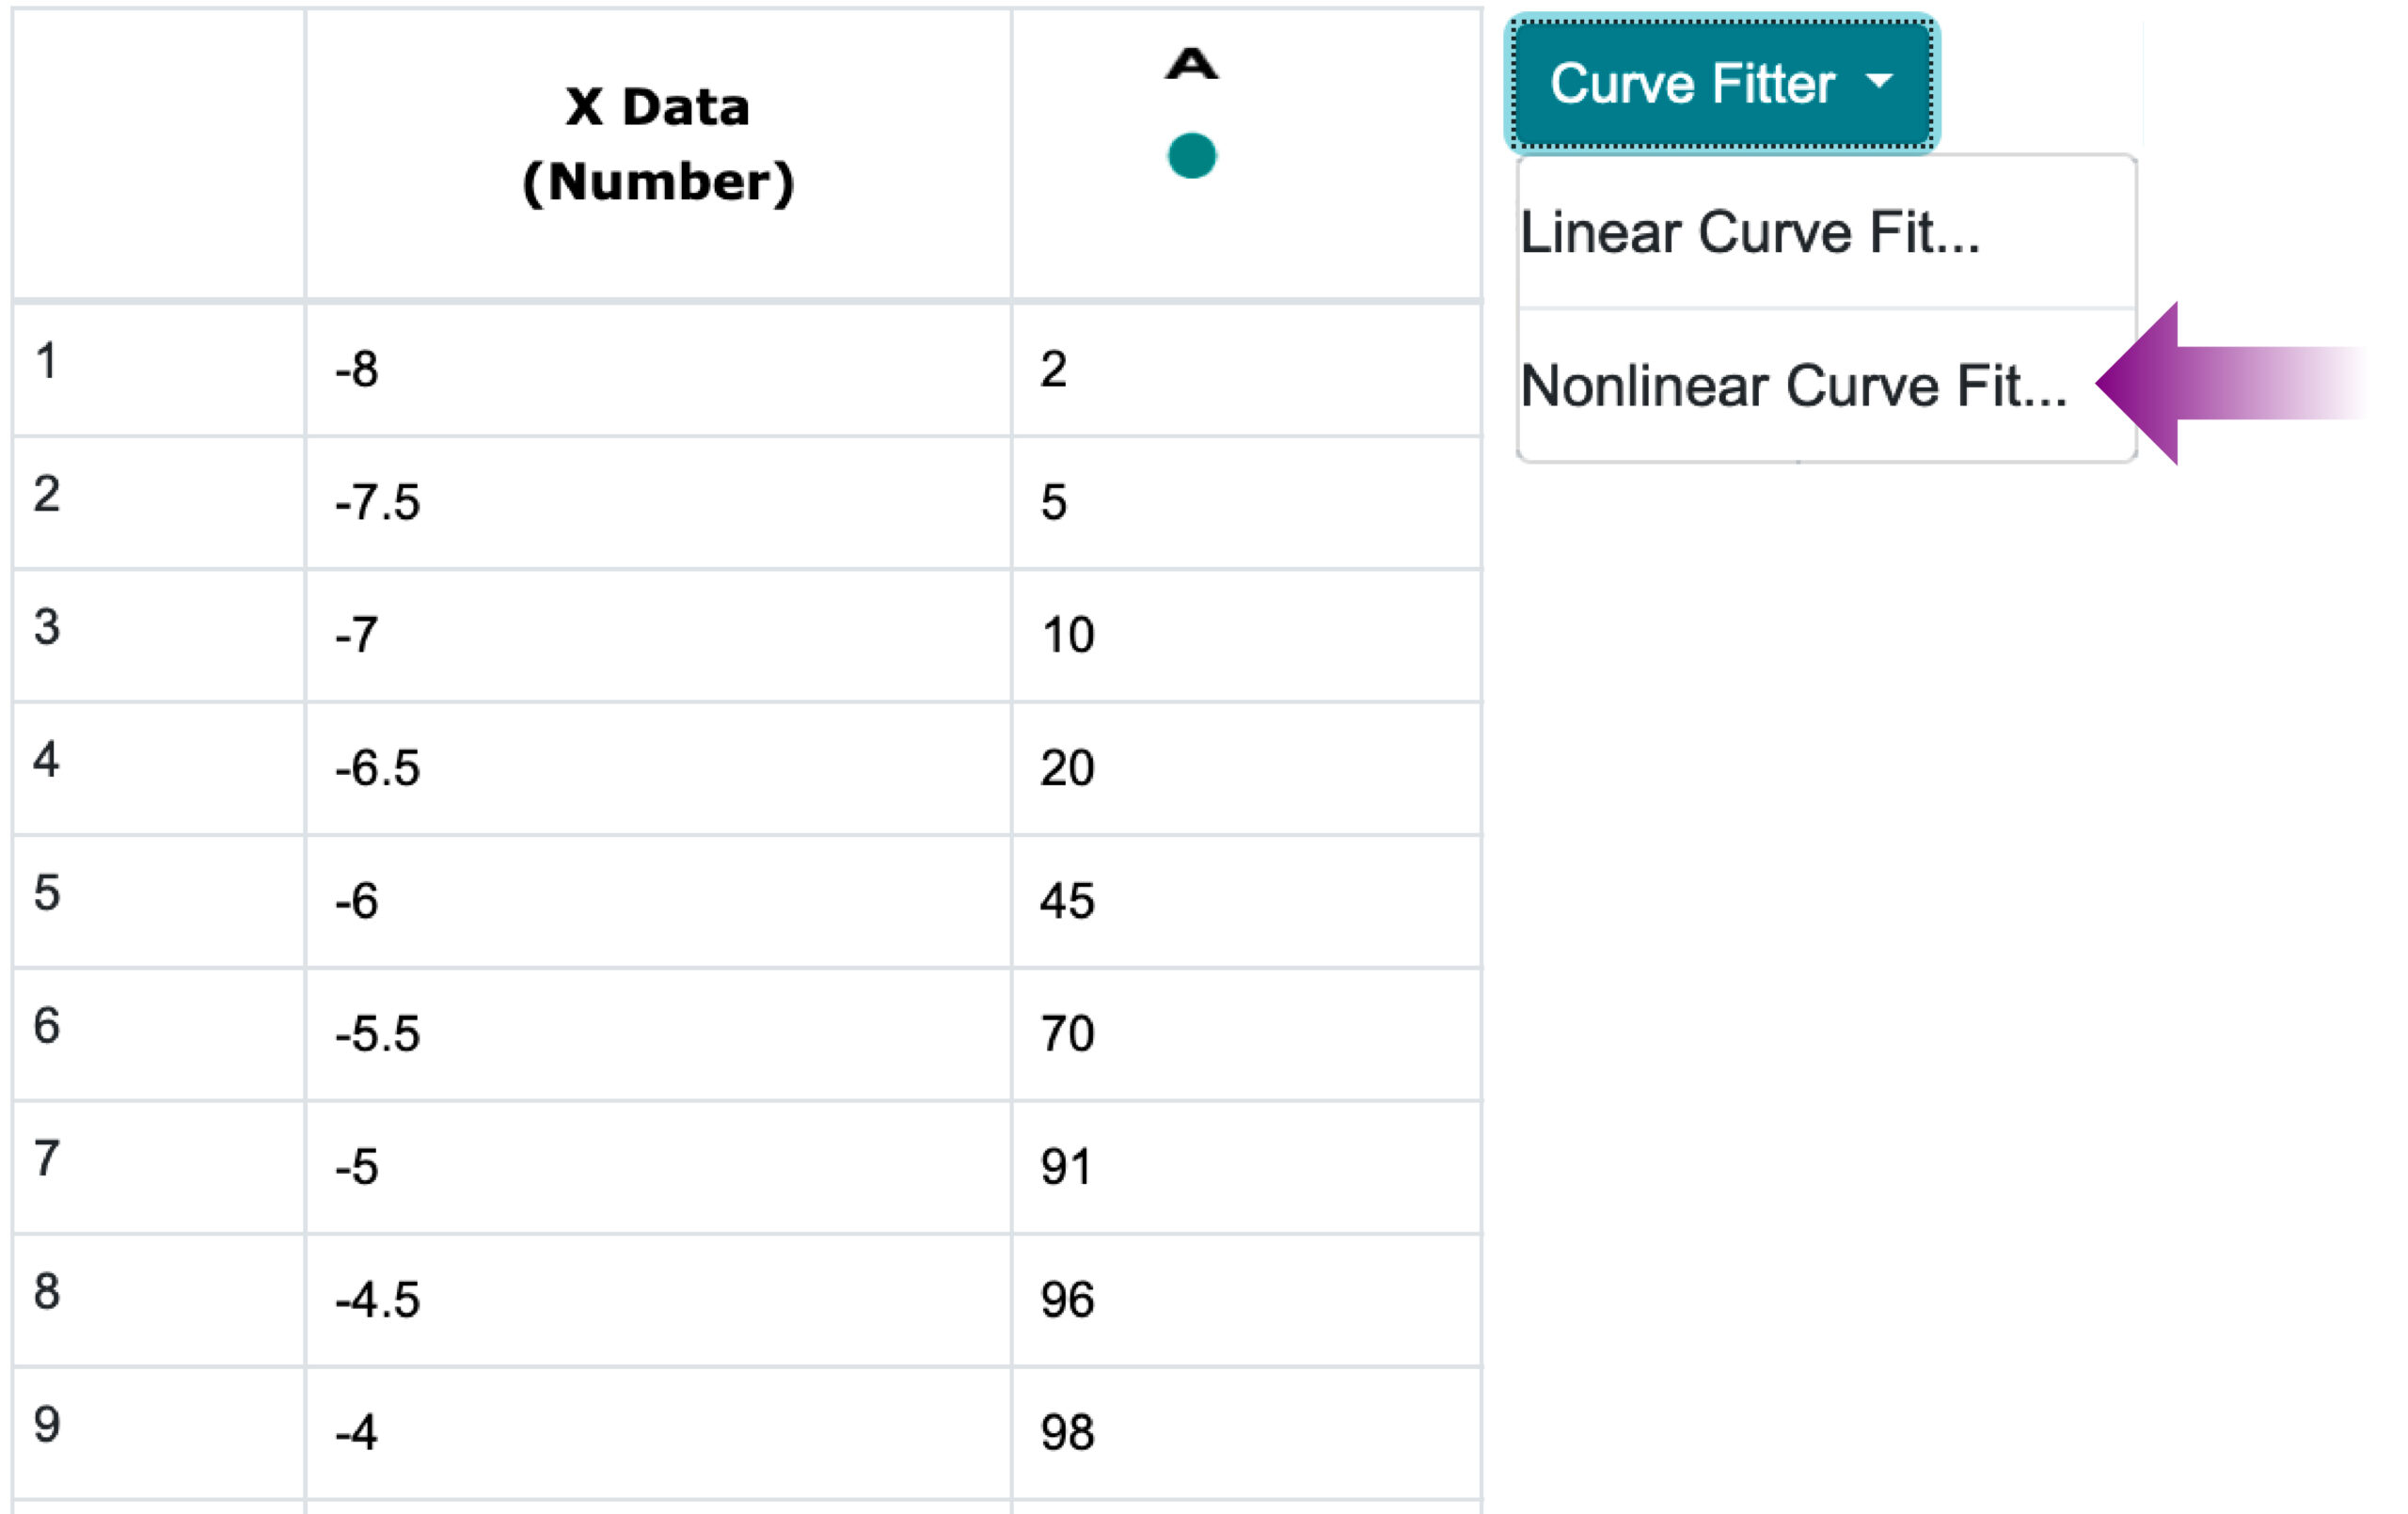
- Select Nonlinear Curve Fit option from the Curve Fitter list
Step 2: Choose Nonlinear Curve Fit Functions
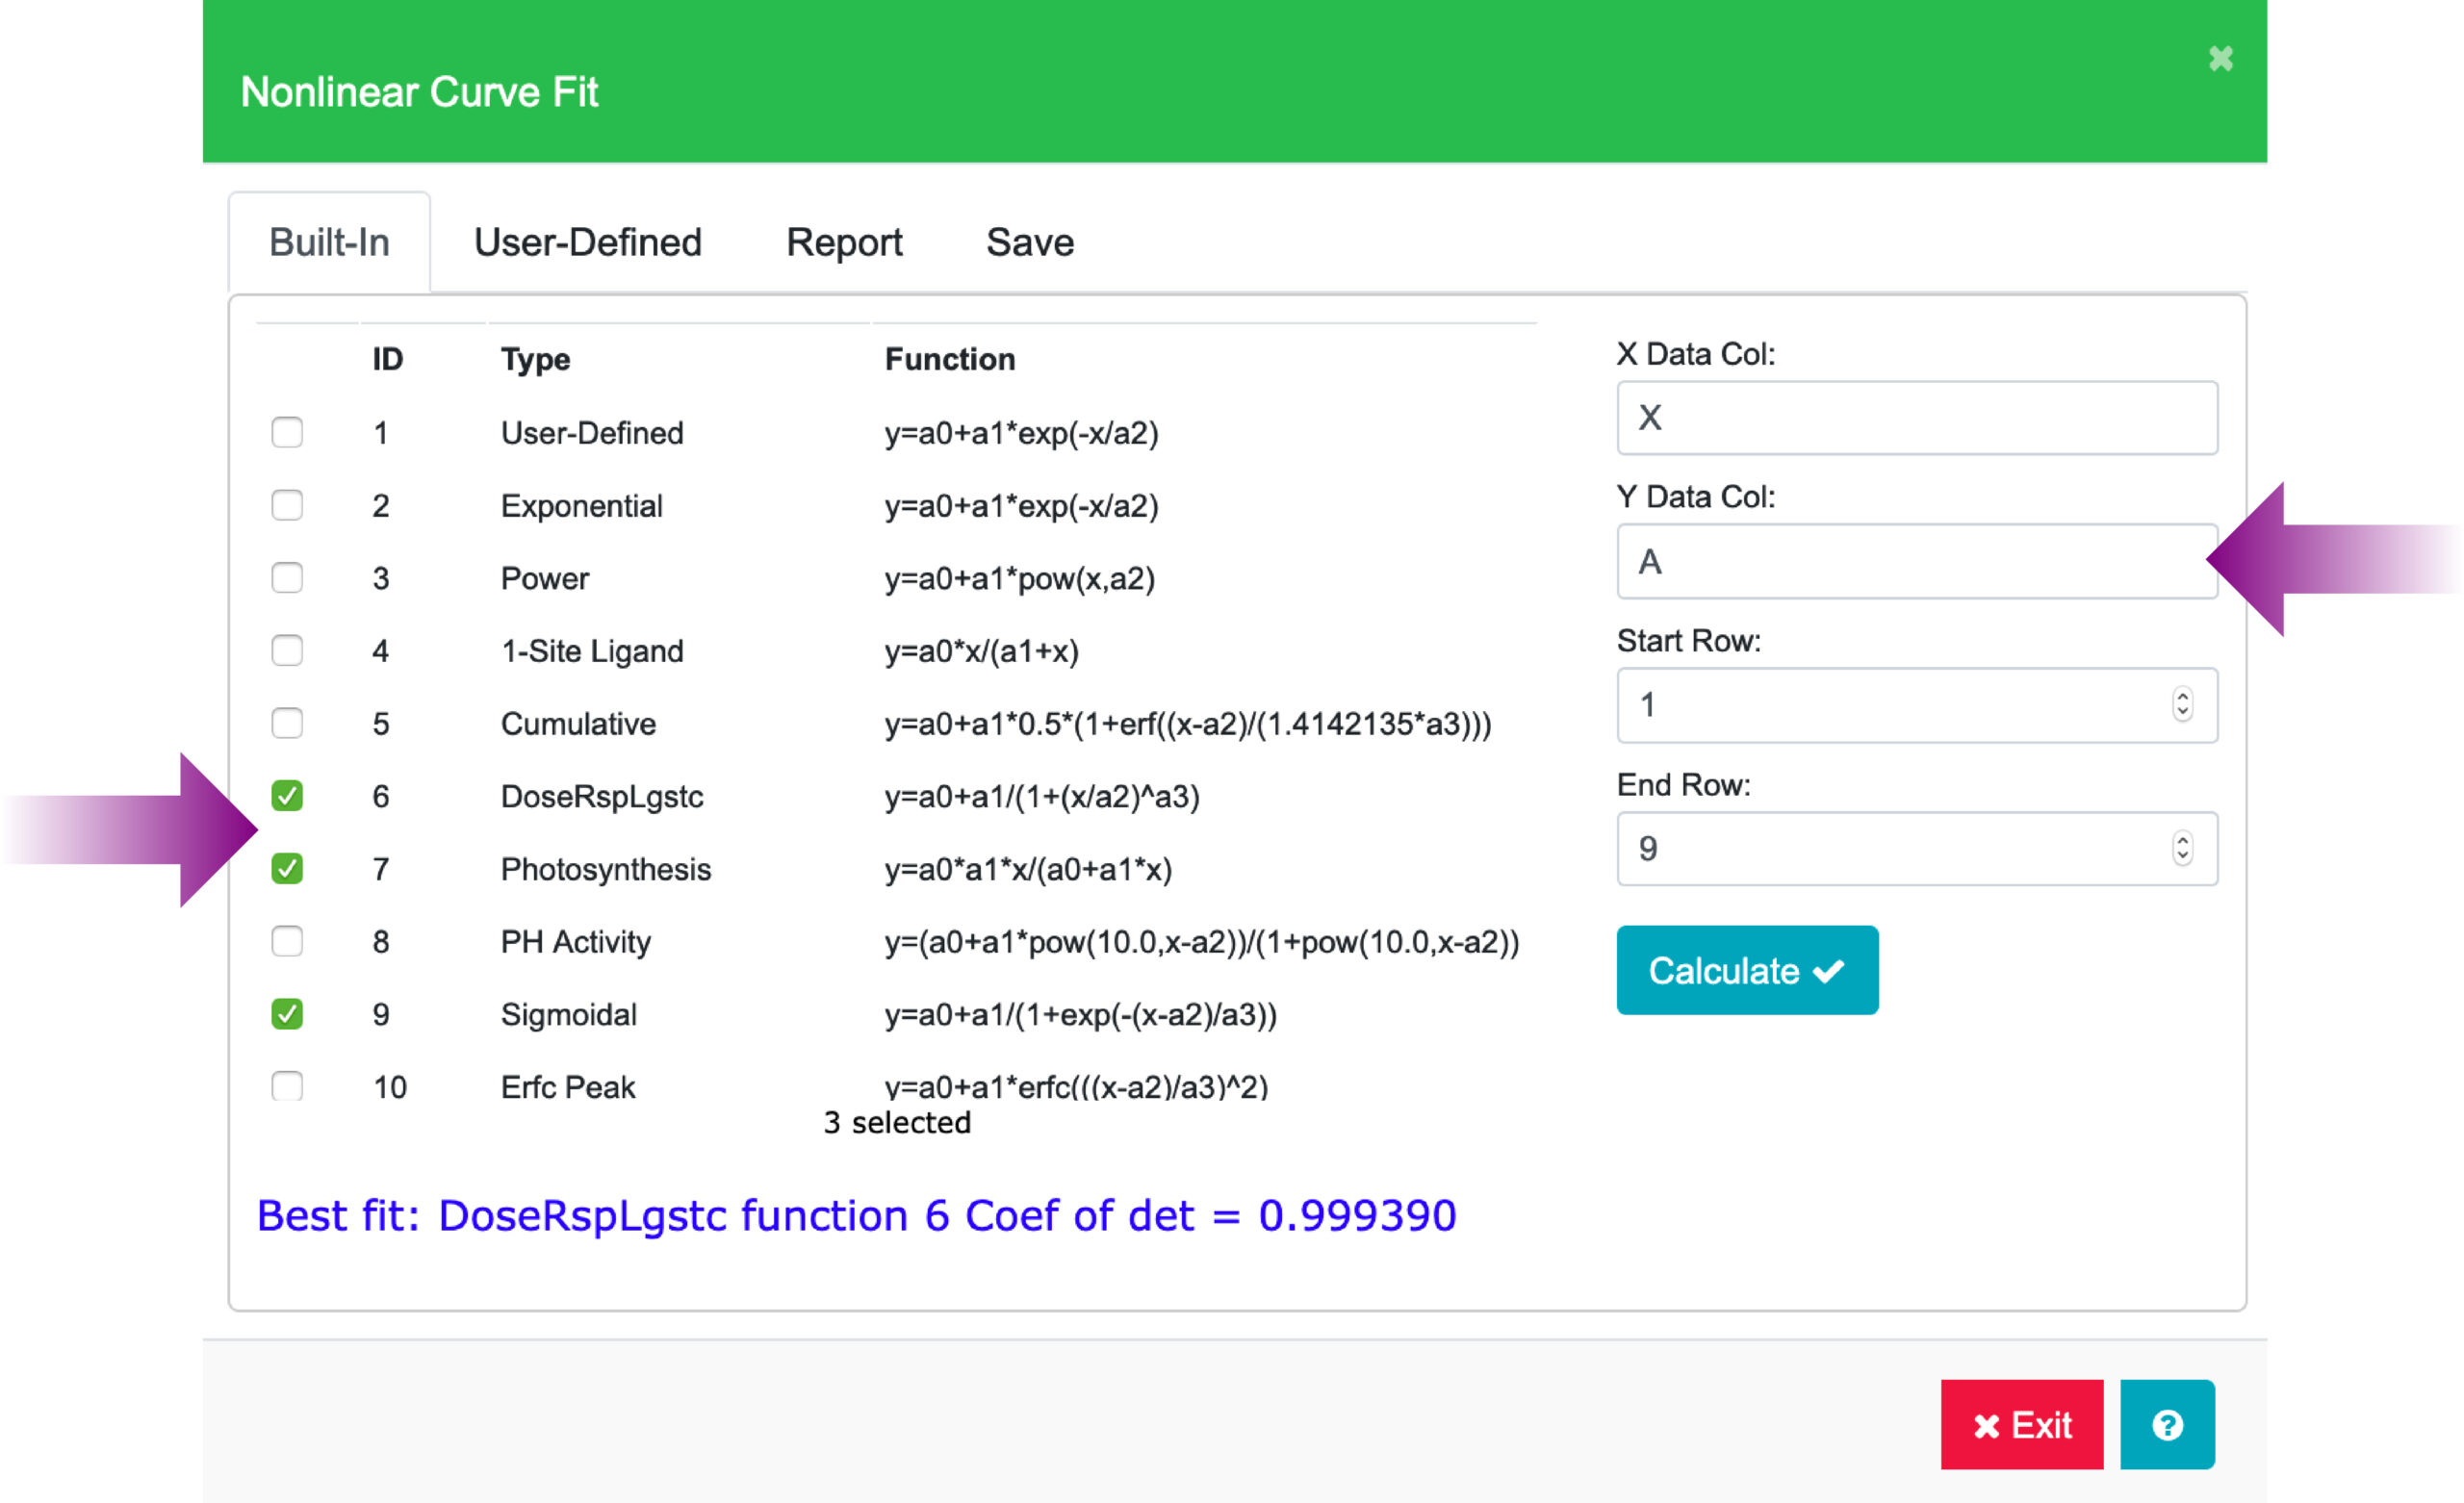
- Select nonlinear curve fit functions from built-in list
- Enter the data columns and rows to curve fit.
- Click on Calculate.
TechGraphOnline will report the best fit among the three selected functions based on the calculated value of Coefficient of Determinate. Dose Response Logistic function is chosen as the best fit for this data set.
Step 3: Report, Save, and Graph Curve Fit Results
The Report and Save tabs are activated once the fit calculation is done.
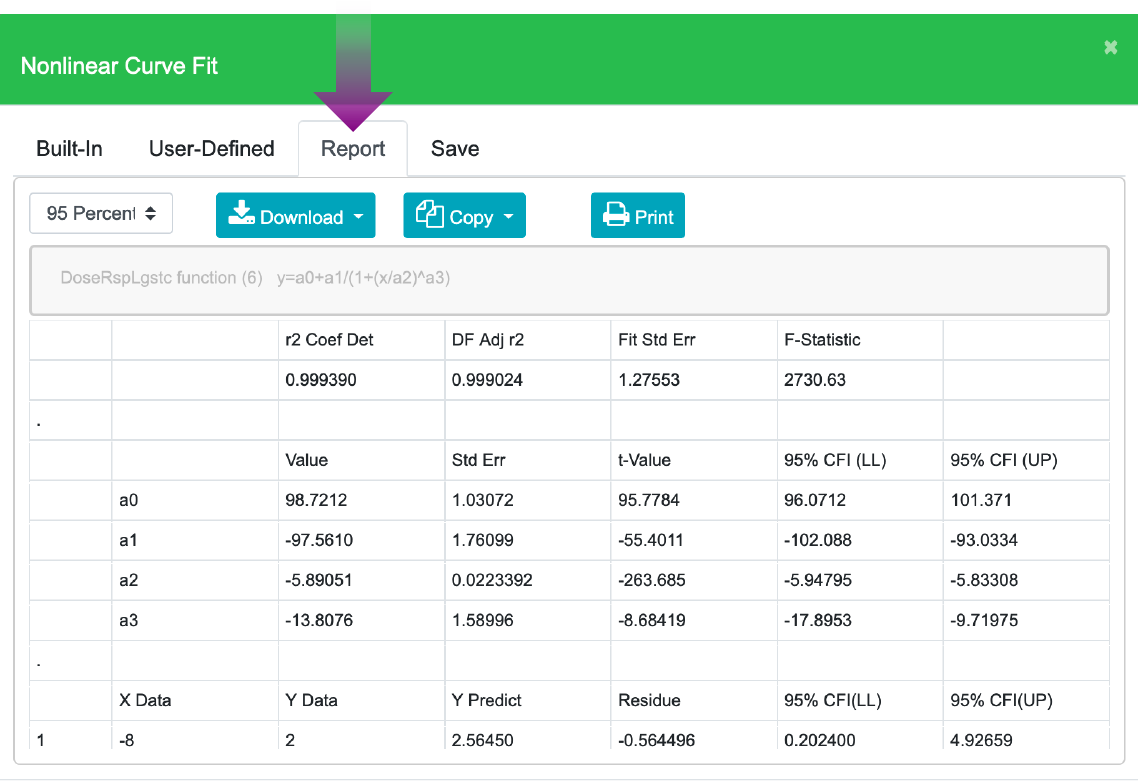
- Click the Report tab view the statistics: coefficients, prediction, and confidence data associated with the curve fit equation. This data can be downloaded as a CSV file and then copied to the clipboard or to the printer.
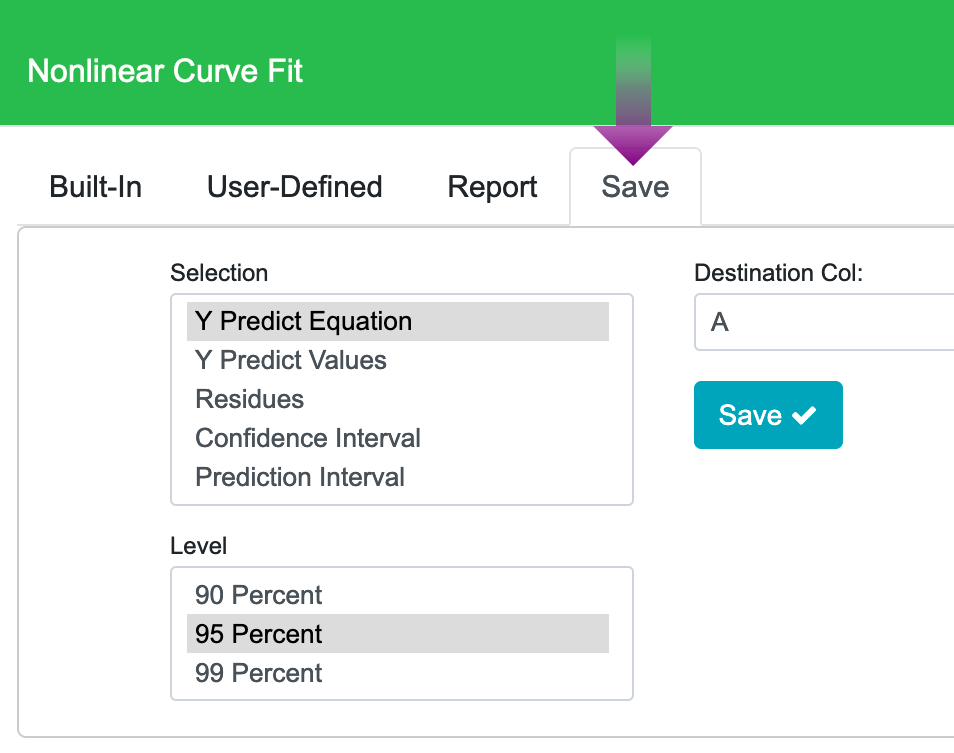
- Click the Save tab.
- Choose what you want to graph: Y Predict Equation, Y Predict Values, Residuals. Confidence Interval or Prediction Interval. Enter ‘A’ in the Destination Col, then Save the Y Predict Equation for Data Series “A”.
- Click the Edit Chart tab to show the finished chart.
